


Route optimization AI has been marketed primarily as a fuel savings tool for a decade, and fleet operators have sized their investment theses accordingly — underestimating the commercial value by a factor of three to four. The real driver of return is vehicle utilization improvement, which compounds across the fleet in ways that fuel savings do not. An 8% fleet utilization lift translates to $1,200 per vehicle in annual operating savings and a deferral of fleet expansion capital that is often ten times the size of the AI investment itself.
|
FLEET UTILIZATION LIFT 8% ↑ AI-optimized routing vs dispatcher baseline |
ANNUAL SAVINGS PER VEHICLE $1,200 ↑ fully loaded, fuel + utilization + maintenance |
|
EMPTY MILES REDUCTION 14% ↓ on AI-dispatched routes vs manual planning |
PAYBACK ON TMS REFRESH 11 mo ↓ for fleets 100+ vehicles with full data integration |
The Metric That Undersold the Category
Route optimization software has been a feature of transportation management systems since the 1990s. The modern AI-powered version — using real-time traffic, weather, demand signals, and machine learning to produce dynamic routes — has been available in commercial form since roughly 2018. The market has grown steadily but has not produced the rapid adoption rate that the productivity data would seem to justify. The explanation lies in how the category has been positioned.
Vendors sold route optimization on fuel savings because fuel is the easiest cost to measure and the most intuitive efficiency lever for fleet operators. Fuel represents 25-30% of total fleet operating cost; a 10% fuel savings is a 2.5-3% operating cost reduction, which is meaningful and quantifiable. The problem is that fuel savings, while real, are the smallest component of the actual value generated by route optimization at enterprise scale.
Gartner's Logistics Hype Cycle for 2025 found that fleet operators who implemented route optimization in the 2018-2022 period reported ROI that was 60-75% of what the vendors had projected, and attributed the shortfall to overstated fuel savings. The fuel savings were not overstated. The business case was simply incomplete: it omitted the vehicle utilization benefit, which is larger, and the maintenance cost benefit, which is additive.
Fleet Utilization: The Number That Changes the Investment Case
Fleet utilization — the percentage of a vehicle's available hours that are generating revenue — is the fundamental driver of fleet economics. A vehicle that costs $80,000 annually in capital, insurance, registration, and maintenance generates return only during the hours it is carrying freight. The average fleet utilization rate across the truckload and last-mile markets, per ATRI's Driver Productivity research, is approximately 62-68%. An 8-percentage-point improvement to 70-76% utilization means each vehicle is generating revenue during 8% more of its available time.
The dollar value of that improvement is larger than the fuel calculation. Bain's Transportation practice converts the utilization improvement as follows: at an average fully loaded revenue per vehicle-hour of $85 in dry van truckload, and 2,500 available revenue hours per year, an 8% utilization improvement represents 200 additional revenue hours per vehicle. Not all of those hours are immediately capturable — the demand may not exist in some markets to fill the incremental capacity — but the improvement reduces the pressure to expand the fleet to meet demand growth.
The capital deferral dimension is where the compounding occurs. A fleet operator managing 500 vehicles with an 8% utilization improvement has effectively added the equivalent of 40 vehicles of capacity without purchasing 40 vehicles. At $150,000 per new vehicle (purchase price plus outfitting), the deferred capital expenditure is $6 million — a figure that dwarfs the TMS refresh investment many times over.
The 14% Empty Miles Reduction
Empty miles — the miles a vehicle travels without revenue-generating cargo — are pure cost. They consume fuel, driver hours, and vehicle wear without generating offsetting revenue. The average empty mile rate in the truckload market is approximately 18-22% of total miles operated, per ATRI's benchmarking. In last-mile and regional distribution, empty mile rates are lower in absolute percentage terms but have a different cost structure because vehicle turns (the number of delivery trips per vehicle per day) are the primary efficiency metric.
Gartner's logistics research finds that AI route optimization reduces empty miles by approximately 14% through two mechanisms. First, better load matching: AI systems with access to freight demand signals can identify backhaul opportunities — revenue-generating loads for the return journey — that dispatchers relying on established broker relationships miss. Second, multi-stop sequencing: AI can optimize multi-stop routes to minimize deadhead miles between stops in ways that human dispatchers, working under time pressure with legacy tools, cannot replicate at scale.
The $1,200 per vehicle annual savings figure includes the fuel, driver time, and maintenance savings from the 14% empty miles reduction, combined with the carrier revenue from backhaul loads that replace empty return trips. Bain's analysis of carriers that moved from human dispatch to AI-assisted dispatch found that the backhaul revenue capture from AI-identified loads, alone, averaged $320 per vehicle per year — a contribution that was entirely absent from vendor ROI models focused on fuel.
The TMS Refresh Investment and the 11-Month Payback
The 11-month payback on a TMS refresh — upgrading from a legacy transportation management system to a modern AI-enabled platform — applies to fleets of 100 or more vehicles where full data integration has been achieved. The data integration condition is critical and is the primary reason some operators are not achieving the documented performance levels.
AI route optimization models require three data inputs to perform at full capability: real-time vehicle telemetry (GPS, driver hours-of-service status, fuel level), real-time order management data (new orders, delivery confirmations, change requests), and external data feeds (traffic, weather, fuel prices, customer receiving windows). Legacy TMS systems often have only partial access to these inputs — particularly real-time order data, which may exist in a separate order management system with no live API connection to the TMS.
Gartner's Logistics research documents that fleets with partial data integration achieve approximately 55% of the utilization improvement available at full integration. At 55% capture, the payback extends from 11 months to approximately 18-20 months. The integration work — building real-time data connections between the TMS, OMS, telematics platform, and external data feeds — typically costs $150,000-$400,000 for a mid-size fleet and should be included in the TMS refresh business case as a required line item, not an optional enhancement.
Maintenance Cost as a Secondary Benefit
The third financial benefit of AI route optimization — after utilization and empty miles reduction — is maintenance cost improvement. Optimized routes reduce the idle time, stop-and-go frequency, and off-highway miles that accelerate vehicle wear. ATRI's driver productivity research found that vehicles on AI-optimized routes showed 6-9% lower maintenance cost per mile than vehicles on dispatcher-generated routes, primarily from reduced brake wear, tire wear, and engine idle hours.
At the fleet scale, this benefit is additive but not transformative — typically $80-150 per vehicle per year. It does, however, compound over vehicle life: a vehicle averaging 200,000 miles per year with 7% lower maintenance cost saves approximately $500-800 over a 5-year ownership cycle, which is meaningful but not the primary investment driver.
The Takeaway
Fleet operators and logistics CFOs evaluating route optimization investments should rebuild the business case from the vehicle utilization improvement outward — not from the fuel savings inward. The 8% utilization lift and the resulting fleet expansion deferral are the primary value drivers; the $1,200 per vehicle annual savings and the 11-month payback are derivative of that utilization improvement. CFOs who approve the investment on a fuel savings case and receive a utilization case in the first year of operation will be surprised by the upside rather than disappointed by the shortfall.
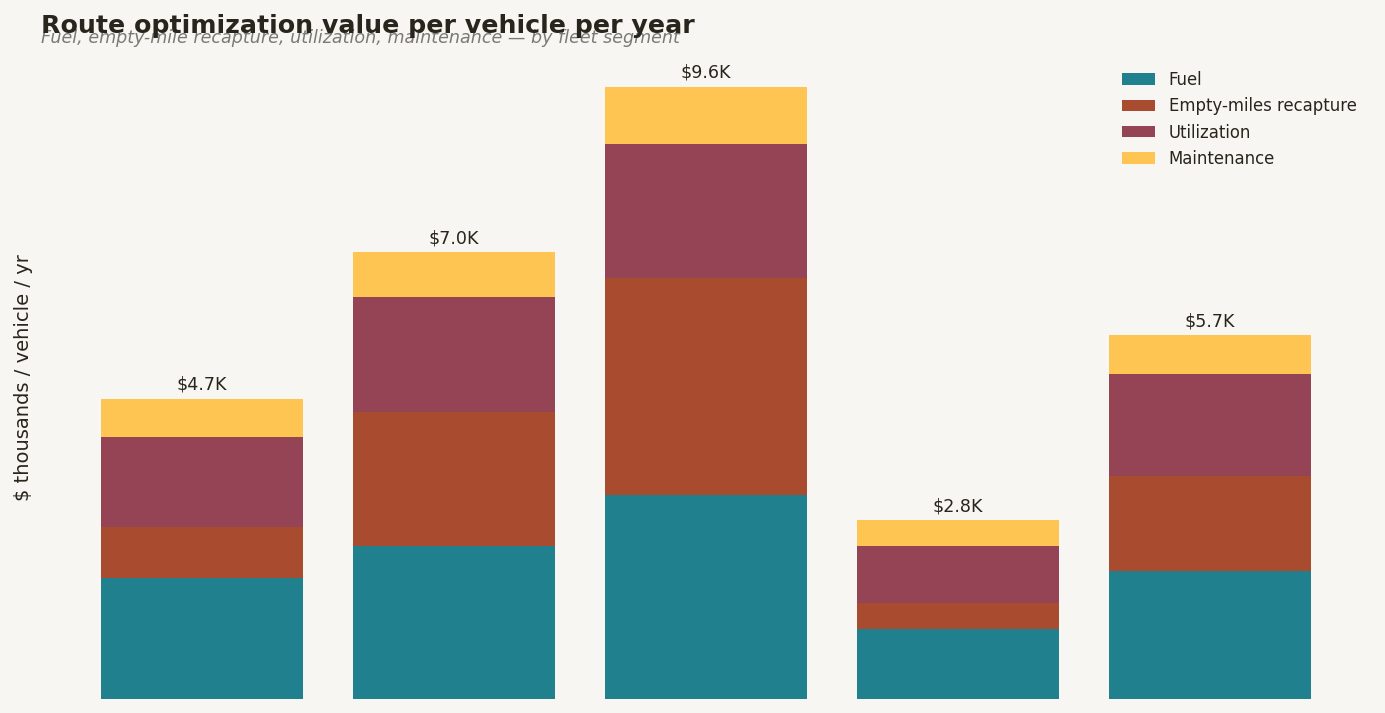
Figure 11. Stacked bar chart showing route optimization value per vehicle by category (fuel savings, empty miles revenue capture, utilization improvement, maintenance reduction), with fleet expansion deferral…
Comments (0)
Join the conversation!