

Predictive maintenance AI has been a perennial pilot candidate since 2018, advancing to board approval at only a handful of Fortune 500 manufacturers before stalling at the proof-of-concept gate. The economics of 2026 are materially different: sensor costs have declined 60% since 2020, model inference is cheap enough to run at the edge, and the unplanned downtime cost data accumulated from five years of pilots has produced payback models that survive CFO scrutiny. The average large-plant-network implementation is now projecting $18 million in annual avoided downtime cost with an 11-month payback — numbers that belong in the capital budget, not the innovation fund.
|
UNPLANNED DOWNTIME REDUCTION 34% ↓ on instrumented production lines |
AVG ANNUAL SAVINGS $18M ↑ large plant network, fully loaded |
|
PAYBACK PERIOD 11 mo ↓ vs 24-36 mo prior generation systems |
OEE IMPROVEMENT 2.1x ↑ on fully instrumented lines vs partial |
Why the Pilots Stalled
The predictive maintenance market has been generating proof-of-concept results since the mid-2010s, and the results were consistently compelling — 20-35% reductions in unplanned downtime, maintenance cost savings of 10-25%, equipment life extension that deferred significant capital expenditures. The pilots worked. What did not work was the path from pilot to corporate program.
Deloitte's 2025 Manufacturing AI Survey identified three structural barriers that killed rollout approvals at Fortune 500 manufacturers repeatedly between 2018 and 2023. First, sensor infrastructure costs: instrumenting a single large facility with the vibration, temperature, and acoustic sensors required for comprehensive equipment monitoring cost $2-4 million in 2020, making plant-network rollout economically prohibitive. Second, connectivity: edge computing and private LTE infrastructure at manufacturing facilities was immature, making real-time sensor data transmission unreliable enough to undermine model performance. Third, model maintenance: the AI models trained during pilots required ongoing retraining as equipment aged and maintenance patterns shifted, and manufacturers lacked the internal ML operations capability to maintain them without the vendor.
All three barriers have changed materially. Sensor costs have fallen 60% since 2020. Private 5G and industrial edge computing infrastructure is now commercially mature from multiple vendors. And the predictive maintenance SaaS market has consolidated around platforms that provide model maintenance as a managed service, eliminating the internal ML ops requirement.
The $18 Million Case: Where It Comes From
McKinsey's Industrial IoT practice published a framework for quantifying predictive maintenance value that has become the standard for board-level capital approval requests. The $18 million average annual savings for a large plant network — defined as 8-12 major production facilities with continuous-process or high-capital-equipment manufacturing — disaggregates as follows.
Unplanned downtime avoidance accounts for approximately 60% of the value. A large automotive or chemicals plant running continuous production can generate $200,000-$500,000 per unplanned downtime hour in lost production, restart costs, and quality scrap from interrupted processes. A 34% reduction in unplanned downtime events at a facility averaging 140 unplanned hours annually represents $9-16 million per year per facility, scaled by the capture rate of the predictive model's actual event detection.
Planned maintenance cost reduction accounts for roughly 25% of the value. Predictive systems allow condition-based maintenance scheduling to replace time-based PM intervals, eliminating unnecessary part replacements and technician labor on equipment that has not yet approached failure conditions. McKinsey's analysis documents average planned maintenance cost reductions of 12-18% on instrumented equipment.
Equipment life extension accounts for the remaining 15%. Catching early-stage degradation before it produces catastrophic failure extends the usable life of major capital equipment. On a plant network with $200-300 million in rotating and precision equipment assets, a 3-5 year extension of average equipment life represents $15-25 million in deferred capital expenditure.
The OEE Multiplier
Gartner's Industry 4.0 Market Guide for 2025 introduced a metric that is gaining traction in manufacturing CFO discussions: the ratio of OEE improvement between fully instrumented production lines and partially instrumented lines at the same facility. The consistent finding across the Gartner survey respondents was a 2.1x OEE improvement advantage for full instrumentation versus partial — a ratio that makes the coverage decision financially clear.
Partial instrumentation — the most common compromise in cost-constrained rollouts — instruments the highest-value equipment and leaves secondary systems on time-based maintenance. The problem is that secondary systems are often the failure point that cascades into primary equipment downtime. A compressor feeding a critical production line is instrumented; the bearing on the motor driving the compressor is not. The bearing fails; the compressor trips; the line goes down. The predictive model had no signal to work with because the failure initiated in unmonitored equipment.
The 2.1x OEE ratio quantifies the cost of this coverage gap. Manufacturers building their capital cases should model full instrumentation as the baseline scenario, not the stretch target, because the OEE arithmetic does not work at partial coverage.
The 11-Month Payback: Conditions and Assumptions
The 11-month payback figure reflects several conditions that are worth stating explicitly. Implementation costs in the McKinsey framework include sensor hardware, edge computing infrastructure, connectivity, platform licensing, and a six-month model training and validation period during which the system is in supervised operation before full production deployment. The figure does not assume any internal ML capability — it is fully vendor-managed.
Deloitte's survey of manufacturers that have achieved production-grade rollout identifies two variables that most strongly determine whether the payback period is achieved: change management investment and maintenance technician training. Predictive maintenance systems generate alerts and recommendations; acting on those recommendations requires maintenance teams that understand how to interpret confidence intervals, failure probability curves, and recommended inspection windows. Facilities that invested in technician training programs saw alert-to-action rates above 85%; those that deployed the technology without structured training programs saw alert-to-action rates below 50%, which directly degrades the downtime avoidance capture rate.
At an 85% alert-to-action rate, the realized downtime reduction is in the 32-36% range. At a 50% rate, it falls to 18-22% — enough to change the payback period from 11 months to 18-22 months and to change the NPV profile of the investment materially.
Regulatory and Insurance Dimensions
Two dimensions of predictive maintenance economics that do not appear in most business cases are insurance pricing and regulatory compliance. Commercial property and equipment breakdown insurers are beginning to price predictive maintenance adoption explicitly, with 3-7% premium reductions available for facilities with certified predictive monitoring programs. On a $5-8 million annual equipment breakdown insurance program — typical for a large manufacturing plant network — the premium reduction is $150,000-$560,000 annually, which is not transformative but is essentially free cash flow.
Regulatory compliance matters in process industries. Chemical manufacturers, pharmaceutical producers, and food processors operate under equipment maintenance documentation requirements that AI-generated maintenance logs can satisfy more comprehensively than manual records. Gartner estimates that the audit documentation efficiency gain from AI maintenance logging reduces compliance cost by 8-12% at regulated facilities — modest, but a legitimate addition to the business case.
The Takeaway
Manufacturing CFOs and COOs who have approved predictive maintenance pilots without approving network rollout should revisit the economics using current sensor costs, current SaaS platform pricing, and the McKinsey downtime avoidance framework with explicit modeling of full versus partial instrumentation. The 11-month payback is achievable at full coverage; the business case that justifies only partial coverage is not the business case that should be presented to the board.
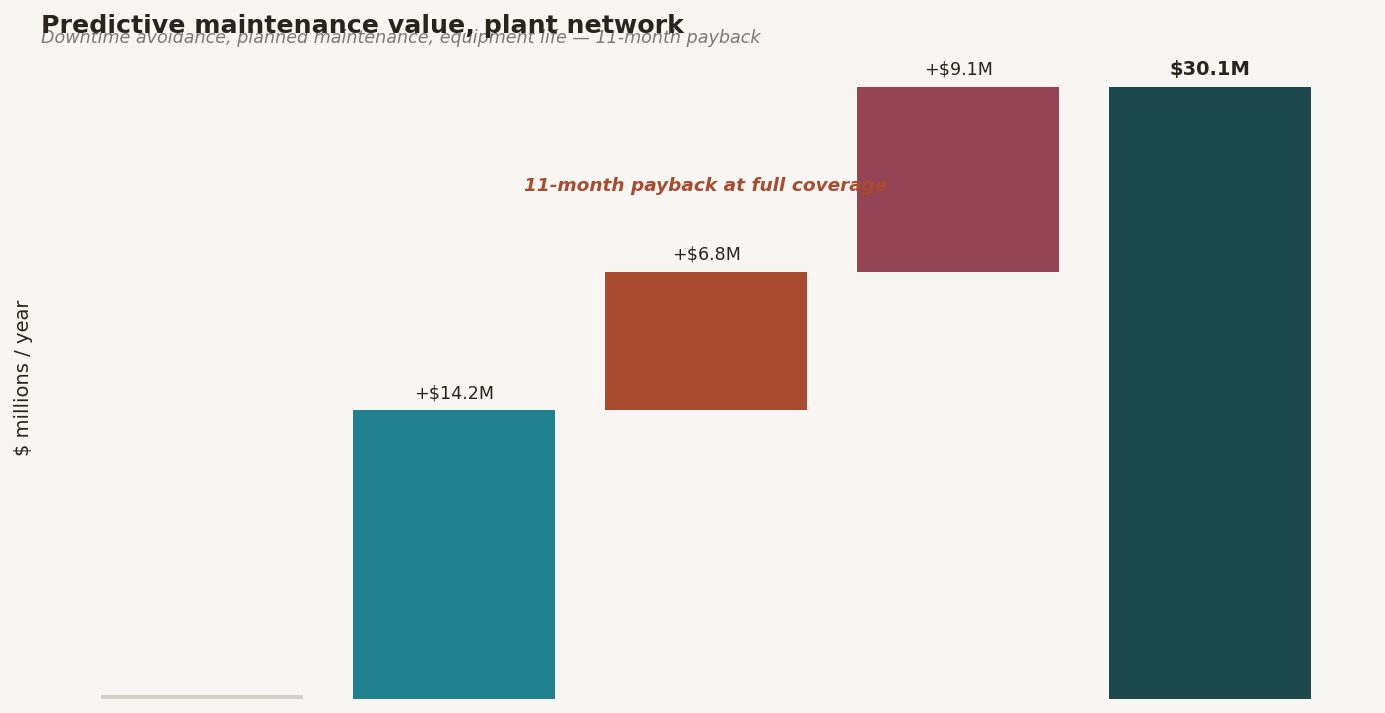
Figure 4. Plant-network waterfall showing value by category (downtime avoidance, planned maintenance reduction, equipment life extension) at full vs partial sensor coverage, with 11-month payback period mark…
Comments (0)
Join the conversation!