

Mid-market retailers that built AI dynamic pricing engines in-house between 2022 and 2024 are discovering that the maintenance cost of a bespoke ML system — averaging $4.2 million annually at the 500-location scale — was never in the original business case. The build-versus-buy calculus has shifted decisively in the past 18 months as SaaS alternatives have converged on comparable gross margin lift at roughly one-quarter of the total cost of ownership. The CFO question is not whether to adopt AI pricing; it is whether the margin captured justifies the infrastructure required to capture it.
|
GROSS MARGIN LIFT 3.8% ↑ in-house engine vs static pricing baseline |
ANNUAL ML OPS COST $4.2M ↓ target via SaaS at $1.1M license |
|
SAAS ALTERNATIVE ANNUAL COST $1.1M ↓ 74% vs in-house ops burden |
TIME TO PRODUCTIZATION 22 mo ↓ median in-house build timeline |
The Build Decision That Made Sense in 2022
When leading retailers began deploying AI-driven dynamic pricing in earnest in 2021 and 2022, the strategic logic for building proprietary systems was defensible. Off-the-shelf SaaS pricing platforms at that time were either category-specific to a narrow vertical, insufficiently integrated with major commerce platforms, or priced for enterprise accounts with eight-figure revenue thresholds that excluded mid-market operators. Retailers with in-house data science capabilities and meaningful e-commerce volume built their own engines, and the early financial results justified the investment. A 3.8% gross margin lift on a $500 million revenue base represents $19 million in annual margin contribution — enough to rationalize a considerable technology investment.
The problem is that the decision was evaluated at build time, not at maintenance time. The annual ML operations cost that has emerged for mid-market proprietary pricing engines — $4.2 million per year at the 500-location scale, per IDC's Retail Pricing Intelligence analysis — was not visible in the pilot business case because pilots are not maintained at production standards.
What $4.2 Million in ML Ops Actually Buys
The $4.2 million annual figure deserves decomposition, because it is frequently challenged by teams that built these systems and have an understandable interest in defending the decision. The cost structure breaks into four components.
Model retraining accounts for the largest share — approximately 35% of the total. AI pricing models trained on historical demand and competitive data begin degrading in accuracy as market conditions shift. Consumer demand patterns shifted meaningfully in 2023, 2024, and again in 2025, driven by inflation dynamics, spending category rotation, and competitive price movement from major platform retailers. Models require quarterly or more frequent retraining cycles to maintain performance, and the compute cost of retraining at production scale is non-trivial.
Data pipeline maintenance accounts for roughly 25% of the cost. Competitive price intelligence — the primary real-time input for dynamic pricing — requires ongoing scraping infrastructure, de-duplication logic, and category mapping that breaks consistently as competitor websites and SKU structures change. Bain's 2026 Retail AI analysis found that mid-market retailers were spending an average of 1.8 data engineering FTEs just on competitive price data pipelines, independent of model development.
The remaining 40% is distributed across feature store maintenance, A/B testing infrastructure, model monitoring and drift detection, and the human review processes required when the model surfaces anomalous pricing recommendations. BCG's Consumer Insights practice has documented that manual review processes alone — reviewing the pricing recommendations the model flags as uncertain — account for 0.6 FTEs per pricing domain at mid-market scale.
The SaaS Alternative Has Caught Up
The competitive landscape for retail pricing SaaS changed materially in 2024 and 2025. Platforms including Revionics (now Aptos), Pricemoov, and Intelligence Node have converged on gross margin lift performance that IDC's benchmarks place within 0.3-0.5 percentage points of mature proprietary systems — a gap that disappears within 12 months of deployment as the SaaS platforms' shared-learning models benefit from cross-client data. The annual licensing cost for enterprise SaaS pricing at the mid-market scale is approximately $1.1 million — roughly 26 cents on the dollar relative to proprietary ML ops cost.
The counterargument from teams defending proprietary builds is that SaaS platforms lack the customization required for specific category dynamics, promotional structures, or channel complexity. This was largely true in 2022 and partially true in 2024. By 2026, the leading SaaS platforms have built category-specific modules for grocery, apparel, electronics, and home goods that accommodate promotional hierarchy, clearance optimization, and omnichannel price consistency. The customization gap has narrowed enough that Bain's retail practice recommends a rebuild-versus-migrate analysis at any proprietary system older than 30 months.
The 22-Month Productization Timeline Hidden the Risk
IDC's research on retail technology deployments found that the median time from in-house AI pricing initiative kickoff to production deployment — meaning the model is live on more than 50% of the SKU catalog — was 22 months for mid-market retailers. This timeline has two financial consequences that were invisible in the original business cases.
First, the competitive advantage window narrows. If the pricing engine takes 22 months to reach production, and SaaS alternatives can be deployed in 4-6 months, the proprietary approach forfeits 16-18 months of margin lift that would have been captured with the SaaS route. At $19 million in annual margin lift, the foregone value from delayed productization is $25-28 million.
Second, the competitive landscape changes during the build. Retailers that began proprietary builds in 2022 targeted competitive dynamics that existed in 2022. By the time their models were in production in 2023 or 2024, the e-commerce pricing environment had been substantially restructured by Amazon's real-time pricing algorithm updates and the entry of Temu and Shein as price setters in mass-market categories. The BCG Consumer Insights work on fast-fashion pricing disruption found that this competitive shift forced two of the five mid-market proprietary engine owners in their sample into unplanned model redesigns before the original engine had reached full deployment.
When Proprietary Still Makes Sense
The argument for maintaining or building a proprietary pricing engine in 2026 is narrow but real. It applies to retailers with: SKU catalogs above 10 million items where SaaS licensing costs scale unfavorably; highly idiosyncratic pricing logic tied to regulatory environments (alcohol, pharmaceuticals, regulated utilities); or proprietary data advantages — private-label velocity data, loyalty program behavioral data — that represent genuine competitive moat unavailable to SaaS vendors building on shared signals.
For the remainder of the mid-market, the financial case for migration is compelling. Bain's 2026 analysis projects that mid-market retailers migrating from proprietary to SaaS pricing will recover the $4.2 million annual ML ops cost, net of migration expense, within 14-18 months, while maintaining gross margin lift within 0.4 percentage points of their proprietary baseline. That is a straightforward NPV decision.
The Takeaway
Retail CFOs with proprietary AI pricing engines older than 24 months should commission a current-state total cost of ownership analysis — not a theoretical rebuild cost, but the actual loaded cost of maintaining the model, its data pipelines, its monitoring infrastructure, and the human review layer. Then compare that figure against current SaaS licensing for the platforms that have reached feature parity. In most mid-market cases, migration will surface $2.5-3 million in annual cost savings while preserving the margin lift that justified the original investment.
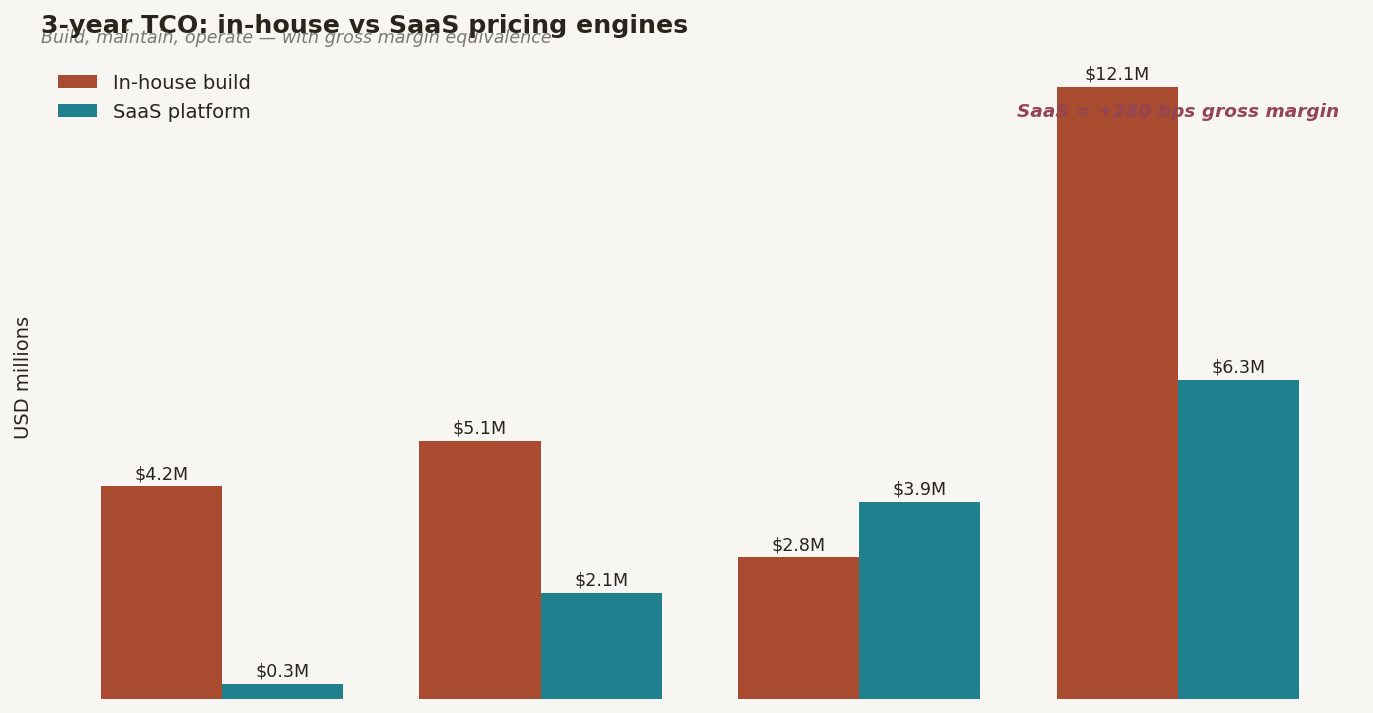
Figure 3. Grouped bar chart comparing total 3-year cost of ownership (build, maintain, operate) for in-house vs SaaS pricing engines at mid-market scale, with gross margin lift equivalence line plotted as se…
Comments (0)
Join the conversation!