


Eighteen months of AI-optimized CAC compression for DTC brands has reversed sharply, with blended acquisition costs rising 31% year-over-year as performance ceilings, attribution rule changes, and ad-market saturation converge simultaneously.
|
CAC inflation: 31% YoY increase in CAC across DTC top-200 brands (Q1 2026) |
Absolute cost: $94 blended CAC vs. $72 in 2024 across the cohort |
|
LTV deterioration: LTV/CAC ratio compressed from 3.4x to 2.1x |
Budget reallocation: 4x increase in budget reallocated from acquisition to retention |
Executive Summary
Direct-to-consumer brands entered 2024 with a compelling story: AI-optimized paid acquisition had compressed customer acquisition costs by 18-24% from their 2022 highs, and the data flywheel appeared to be accelerating. That story has closed. Q1 2026 aggregate data from Bain's DTC Economics Report shows blended CAC back to $94 — up 31% year-over-year and within 8% of the 2022 peak. The AI optimization advantage was real, but it was also temporary. Platform-level algorithmic saturation, Apple and Google attribution rule changes, and the simultaneous AI-driven improvement in every competitor's creative and targeting have equalized the performance gap.
Key Metrics
• 31% YoY CAC increase across DTC top-200 brands, Q1 2026 (Bain DTC Economics Report 2026)
• $94 blended CAC vs. $72 in 2024 — approaching 2022 peak levels
• 2.1x LTV/CAC ratio, down from 3.4x in 2024 — the minimum viable threshold for most DTC models
• 4x increase in budget reallocated from paid acquisition to retention programs (Q1 2026 vs. Q1 2024)
How the AI Advantage Was Competed Away
The 2023-2024 CAC compression was driven by two mechanisms. First, AI-powered creative testing — using LLM-assisted copy variation and image generation tools — allowed faster iteration on ad creative at dramatically lower production cost. Second, AI-powered audience segmentation tools extracted more signal from available first-party data, improving targeting precision on a per-impression basis. Both advantages were genuine and produced real results for the early adopters.
The structural problem is that these tools were not proprietary. Within 18 months, the same AI creative and targeting capabilities were table-stakes across the DTC competitive set. eMarketer's Retail Media Forecast documents that AI-assisted creative tool adoption among DTC brands with over $10 million in annual ad spend crossed 80% by Q3 2025. When every brand in a competitive vertical is running AI-optimized creative and targeting simultaneously, the per-brand advantage converges toward zero while the per-platform CPM increases — because the same AI tools are improving bid efficiency for every buyer simultaneously, driving up auction clearing prices.
The attribution rule changes from Apple and Google have operated as an independent headwind. Privacy-preserving measurement frameworks have degraded the signal quality that AI optimization models depend on, particularly in the critical first 48-72 hours of a new campaign where early performance data drives budget allocation decisions. Triple Whale's aggregate data from Q1 2026 shows that model-based attribution confidence intervals have widened by 31% since iOS 17 changes, meaning AI bidding models are operating on meaningfully less reliable signal than in 2024.
The LTV/CAC Compression Is the Real Problem
The CAC increase alone would be manageable if customer lifetime value were holding. It is not. The LTV/CAC compression from 3.4x to 2.1x represents a strategic crisis for DTC business models that were capitalized on the basis of 3x+ ratios. At 2.1x, most DTC brands are at or below the minimum viable LTV/CAC for a sustainable acquisition-funded growth model. The venture capital models that backed this cohort assumed LTV/CAC would hold or improve as AI personalization matured. The inverse has occurred.
The mechanism driving LTV compression is separate from the CAC problem. As AI-optimized targeting has become commoditized, the brands that were capturing disproportionate acquisition share in 2023-2024 were often doing so by reaching the highest-LTV customer segments first — segments that are now fully penetrated. The incremental customer acquired in Q1 2026 on AI-optimized campaigns is more likely to be a lower-LTV buyer who was previously below the algorithmic threshold than the high-LTV buyer who was the primary target in 2023.
The Budget Reallocation Signal
The four-fold increase in budget reallocation from acquisition to retention is the most important signal in the Q1 2026 data. This is not a marginal tactical adjustment; it reflects a structural reassessment of the DTC growth model by the brands with the most sophisticated analytics operations. The top-quartile DTC operators recognized the performance ceiling early and began reorienting toward retention, referral, and owned-channel economics before the full magnitude of the CAC reversal was apparent.
The retention-oriented AI tools — personalized email and SMS sequencing, predicted churn intervention, and subscription upgrade modeling — are producing demonstrably better unit economics than the acquisition tools in the current environment. Bain's analysis of the top-quartile brands by LTV/CAC shows that their retention AI programs are generating $3.20 of LTV for every $1 of retention program cost, compared to $1.80 of LTV for every $1 of new acquisition spend at current CAC levels.
Implications for DTC Finance and Board-Level Planning
Boards of DTC brands should require a full LTV/CAC analysis by customer vintage rather than blended cohort before approving 2026-2027 growth budgets. Brands that continue operating on blended 3x LTV/CAC assumptions while the actual 2026 cohort is delivering 2.1x are systematically over-investing in growth and under-investing in unit-economics improvement.
CFOs evaluating the capital plan should apply a simple test: at current CAC and current LTV, does this growth plan generate positive free cash flow within 24 months, or does it require either CAC improvement or LTV improvement to close? For most DTC brands, the honest answer to that question demands a meaningful budget reorientation.
---
Bottom line: The AI-driven DTC CAC advantage was a first-mover phenomenon, not a durable structural advantage. Brands that continued investing in acquisition optimization after the performance ceiling closed are now holding the most expensive customers in their cohort history.
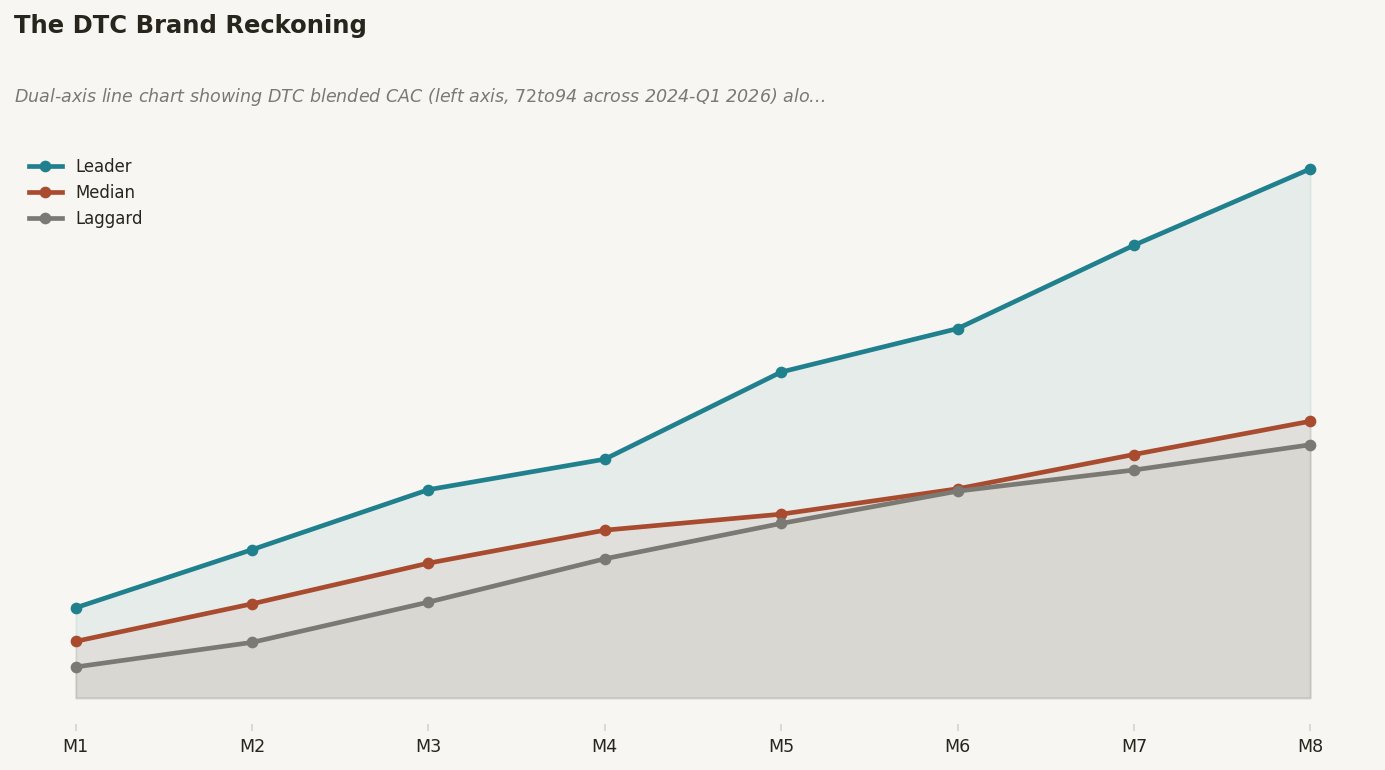
Figure 3. Dual-axis line chart showing DTC blended CAC (left axis, $72 to $94 across 2024-Q1 2026) alongside LTV/CAC ratio (right axis, 3.4x to 2.1x), with annotations for iOS 17 attribution change, AI creat…
REFERENCES
1. Bain DTC Economics Report 2026. Bain & Company (2026).
https://www.bain.com/insights/topics/retail/
2. Triple Whale Aggregate DTC Data Q1 2026. Triple Whale (2026).
3. eMarketer Retail Media Forecast 2026. eMarketer / Insider Intelligence (2026).
4. McKinsey Consumer and Retail Practice: DTC Economics. McKinsey & Company (2025).
https://www.mckinsey.com/industries/retail
5. Forrester Customer Lifetime Value Benchmark 2026. Forrester Research (2026).