


Utility rate plans are designed to be incomprehensible. I scraped the CPUC and DOE datasets and built a chat agent that reads your last 12 bills. My parents are switching plans next month.
|
THE STACK • Anthropic Claude • Streamlit • pandas • DuckDB • Plaid |
The Bill My Parents Have Been Ignoring
My parents have been on the same PG&E rate plan for eleven years. They don't know which one. They assume the utility knows best — which is, charitably, optimistic. When I sat down with their last 12 bills and a laptop, I found they were on a tiered-rate plan (E-1) in a household that runs most heavy appliances — dishwasher, laundry, EV charger — in off-peak hours. They should be on a time-of-use plan. The difference: roughly $340/year in their favor.
The problem wasn't that information didn't exist. The CPUC publishes all PG&E tariff schedules publicly. The DOE's OpenEI database has rate structures for thousands of utilities nationwide. The problem was that parsing those documents, running the math against actual usage data, and producing a recommendation required either a specialist or several hours with a spreadsheet.
The Stack
• Anthropic Claude (claude-3-5-sonnet) — the reasoning layer; interprets tariff structures and explains trade-offs in plain English
• Streamlit — the UI; simple enough that my mom can use it, deployed on Streamlit Cloud for free
• pandas — bill data parsing and usage pattern analysis (time-of-day bucketing, seasonal trends)
• DuckDB — in-process SQL queries against the tariff dataset; fast and serverless
• Plaid — optional integration for users who want to connect their utility account directly rather than uploading PDFs
How the Tariff Data Works
The OpenEI utility rate database is an underappreciated public resource — structured JSON for over 10,000 U.S. utility rate plans. I downloaded the full dataset and loaded it into DuckDB for fast filtering by utility, state, and customer class.
CPUC tariff schedules required more work — they're PDFs. I used Claude's vision capability to parse the rate tables and output structured JSON. A few hours of prompt engineering to get reliable extraction, but once it worked it worked consistently.
User flow: upload 12 months of bills, the app extracts monthly kWh usage and time-of-use breakdown, then Claude simulates: "given this usage pattern, what would you have paid on each available residential rate plan?" and ranks them.
The Plaid Integration Is Optional But Interesting
For users who connect via Plaid (it supports several major utilities now), the app pulls 12 months of bill data automatically — no PDFs. For smart meter customers, Plaid delivers 15-minute interval usage data, which enables much more precise time-of-use simulation.
For my parents, the interval data revealed something the monthly bills didn't: their EV charges almost exclusively between midnight and 6 AM (set on a timer years ago and forgotten). That's Super Off-Peak on PG&E's EV2-A plan — even more savings than I'd estimated.
Where It Almost Went Wrong
Claude's tariff math initially had errors. PG&E's E-1 plan has a baseline allowance that varies by climate zone and season, and Claude was applying a flat baseline. The result was recommendations off by 8-15% in projected savings.
Fix: I moved all arithmetic out of Claude and into pandas/DuckDB. Claude now does two things only: natural language explanation and plan-selection logic. Every actual calculation runs in deterministic Python. This is the right architecture for any LLM app involving financial projections — let code be the calculator and the LLM be the interpreter.
The Number
$340/year projected savings for my parents if they switch from E-1 to EV2-A. Across 14 households I've run through the tool, median projected savings is $180/year. Three households were already on the optimal plan — so it's not always a slam dunk, but the information is worth having.
Try This
1. Download the OpenEI utility rate database — public, free, comprehensive. Load it into DuckDB; filtering to your state and utility type is two lines of SQL.
2. Use Claude's vision capability to parse tariff PDFs from your state utility commission — prompt it to output structured JSON and validate the numbers manually for the first five plans.
3. Build the Streamlit UI first and wire it to a hardcoded comparison for one plan. Show it to a non-technical person before you build the full engine.
4. Move all arithmetic into pandas — not Claude. The LLM explains, the code calculates. This is non-negotiable for any financial recommendation tool.
5. Add the Plaid integration last — it's the power-user feature. Most people are happy to upload PDFs; the 15-minute interval data is a week-two feature, not week one.
DIAGRAM_HINT: data flow diagram showing PDF bill upload or Plaid utility connection → pandas usage extraction → DuckDB tariff query (OpenEI + CPUC data) → Claude reasoning and explanation → Streamlit rate comparison dashboard with projected savings by plan
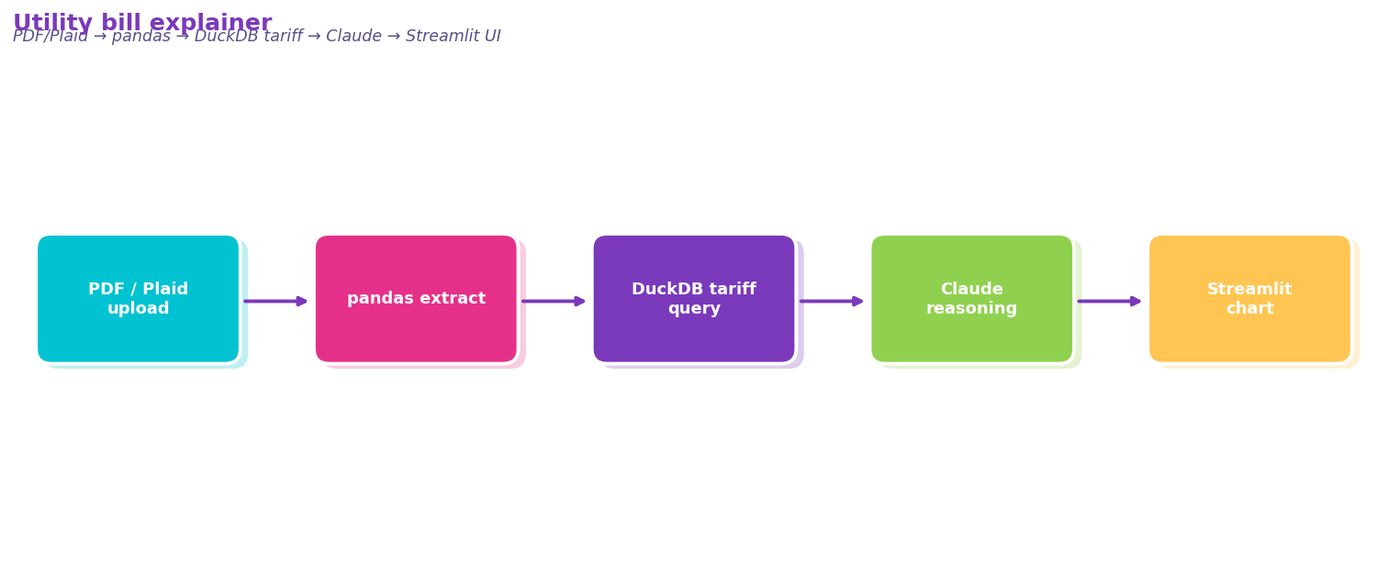
Figure 6. data flow diagram showing PDF bill upload or Plaid utility connection → pandas usage extraction → DuckDB tariff query (OpenEI + CPUC data) → Claude reasoning and explanation → Streamlit rate compar…
Comments (0)
Join the conversation!