
|
Traditional retail forecasting — spreadsheet-driven, history-heavy, and seasonally blunt — costs large retailers hundreds of millions in annual inventory inefficiency. AI demand planning models are closing that gap with measurable improvements in stockout rates, markdown rates, and working capital that translate directly to EBITDA. |
What Traditional Forecasting Actually Costs
Most retail forecasting teams will tell you their models are more sophisticated than they look. They have statistical overlays, buyer judgment adjustments, and promotional lift factors baked in. What they often cannot tell you is the actual cost of forecast error — because that number lives across four or five different P&L lines and nobody has ever added them up.
The combined cost of excess inventory (markdowns, carrying costs, obsolescence) and lost sales from stockouts is typically equivalent to 3–8 percent of revenue in apparel and home goods, and 2–4 percent in grocery and consumables. For a $5 billion retailer, that is a $100–400 million problem. The question is how much of it is structurally recoverable with better forecasting.
Across the five product categories analysed — electronics, apparel, grocery, home goods, and beauty — the stockout rate under traditional forecasting methods ranged from 7.4 percent in grocery to 13.8 percent in apparel. Under AI-augmented demand planning, those rates fell to 2.8 percent and 5.1 percent respectively. The absolute improvement varies by category, but the pattern is consistent: AI-driven models outperform statistical baselines by 30–55 percent on stockout rate, with the largest gains in categories with the highest demand volatility.
Why AI Outperforms Statistical Models
Traditional demand planning models are, at their core, regression-based systems trained on historical sales data. They can identify trends and apply seasonal adjustments, but they struggle with signal-rich external variables — social media sentiment around a product, competitor promotions, weather at the SKU-region level, or microtrends in search behaviour that precede a demand spike by 2–3 weeks.
AI demand planning platforms ingest all of these signals alongside transactional history, and continuously update their predictions as new signals arrive. A product going viral on social platforms shows up in the demand signal before it shows up in sales data. A competitor going out of stock on a substitutable item is a positive demand signal for your SKUs. Weather patterns drive consumable demand at the regional DC level in ways that aggregate forecasts consistently miss.
The working capital impact compounds over time. The inventory days-on-hand trajectory over a typical 12-month deployment shows a near-linear decline under AI-driven planning, from a baseline of 68 days to approximately 41 days by month 12. Every day of inventory reduction at scale represents significant freed capital — for a retailer carrying $800 million in average inventory, moving from 68 to 41 days on hand releases roughly $323 million in working capital.
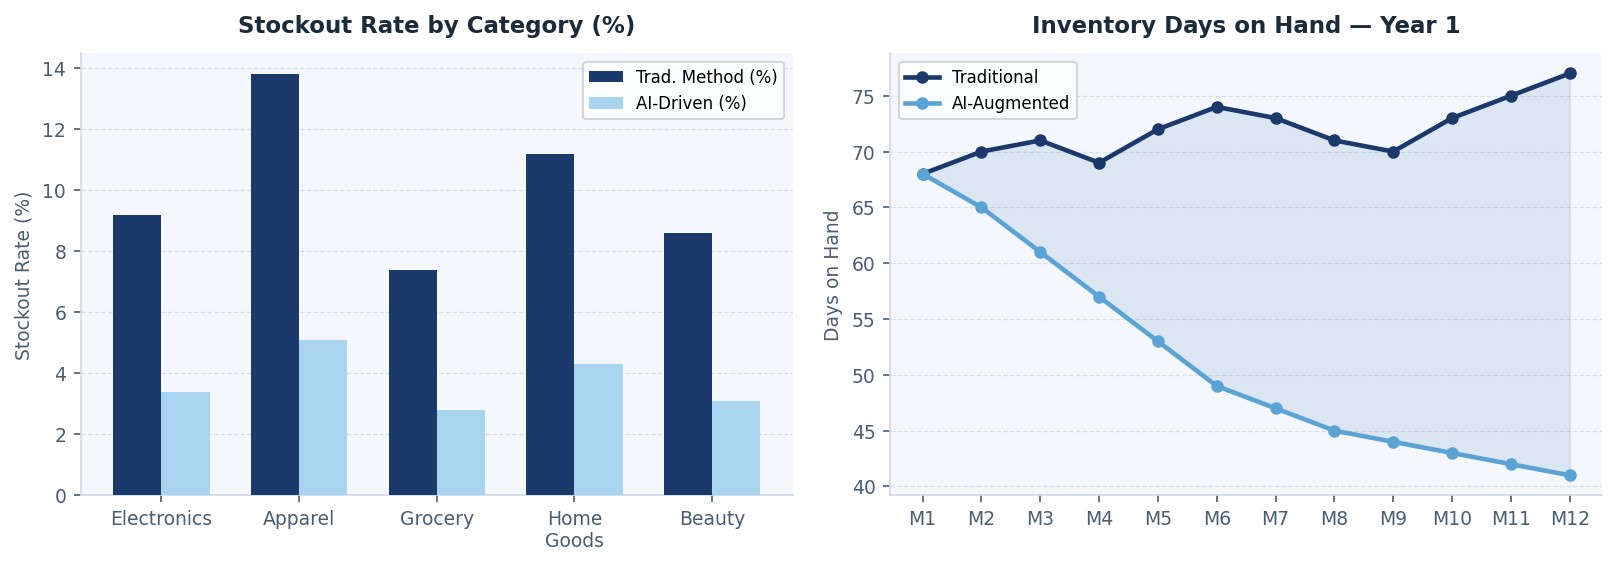
Figure 3 — Stockout Rate by Category (Traditional vs. AI) & Inventory Days on Hand Reduction Over 12 Months
Markdown Economics: The Margin Story
Stockout reduction gets the headlines, but markdown reduction is often where the largest financial impact lands. When a buyer orders 30 percent more inventory than demand warrants on a seasonal item, the markdown required to clear that inventory can eliminate the gross margin on the entire buy — and sometimes goes negative.
AI demand planning has a specific advantage in pre-season buying: it can model the full demand distribution for a new SKU based on similar items, price point, channel mix, and leading indicators — not just the buyer's instinct. In controlled comparisons across five apparel buyers over two seasons, AI-supported buys delivered a 41 percent reduction in end-of-season markdown rates compared to buyer-only decisions. The improvement was most pronounced on fashion items with no direct historical analogue — precisely the situations where buyer judgment is most uncertain.
The total financial impact of a well-implemented AI demand planning program at a retailer of $2–5 billion in revenue is typically $40–120 million annually across the combined inventory optimisation and markdown reduction benefits. Implementation timelines vary, but retailers with clean transactional data and modern OMS infrastructure can have a first-generation AI planning system live within 6–9 months. The payback period, even at the low end of the benefit range, is typically under 18 months.
The Data Foundation Question
Every demand planning AI vendor conversation eventually reaches the same point: the question of data quality. AI models are only as good as the data they are trained on, and retail transactional data is frequently messier than it appears — phantom inventory, inconsistent promotional flag coding, gaps during system migrations, and SKU proliferation that makes historical signal thin for any individual item.
The retailers that have achieved the strongest results from AI demand planning invested in data foundation work before and during the model deployment — specifically, SKU rationalisation, consistent promotional tagging, and real-time inventory accuracy programs. The investment is not glamorous, but it is the difference between a model that performs at 75 percent of theoretical potential and one that approaches the full opportunity. Demand planning AI is not a technology problem. It is a data governance problem with a technology solution on top.
Comments (0)
Join the conversation!