

Commercial lenders that deployed AI-augmented underwriting in 2025 are reporting fully-loaded cost per file of $3.40 against a manual baseline of $19.80 — a structural advantage that compounds with volume. The payback window on enterprise implementations is averaging 7.2 months, well inside a single fiscal year, which means this is no longer an innovation budget question. It is a capital-allocation question, and the banks still running legacy workflows are ceding spread to faster competitors.
|
TIME-TO-DECISION 68% ↓ 14 days → 4.5 days |
COST PER FILE $3.40 ↓ vs $19.80 manual baseline |
|
PAYBACK PERIOD 7.2 mo ↓ vs 18-24 mo legacy IT cycles |
APPROVAL THROUGHPUT 11% ↑ net of credit-quality controls |
The Underwriting Economics That Changed in 2025
For the better part of a decade, commercial underwriting productivity was a staffing problem dressed up as a technology problem. Banks hired more credit analysts, senior lenders complained about cycle time, and the average time-to-decision on a mid-market commercial credit facility sat stubbornly between 12 and 18 days. The answer vendors sold was workflow software. The problem was that workflow software did not change the fundamental labor content of reading a borrower's financials, spreading statements, and generating a credit memo.
What changed in 2025 was not the ambition — it was the accuracy. Large language models fine-tuned on institutional credit data crossed a reliability threshold that allowed banks to put them in the critical path rather than the back office. McKinsey's 2025 Banking AI survey documented a 68% reduction in time-to-decision at institutions that had moved from pilot to production-grade deployment, compressing the average commercial credit cycle from roughly 14 days to 4.5 days. That is not incremental improvement. That is a structural change in the competitive offering.
What the Cost-per-File Number Actually Measures
The $3.40 versus $19.80 cost-per-file comparison requires some unpacking because the denominator matters. The $19.80 figure — drawn from Deloitte's Center for Financial Services analysis of mid-market commercial banks — includes fully-loaded analyst compensation, management review time, compliance screening, and the rework cost embedded in a process where first-pass memos require an average of 2.3 revision cycles before committee presentation. It is a real economic cost, not a theoretical one.
The $3.40 figure reflects AI-augmented processing: automated financial spreading, AI-generated first-draft credit memo, compliance and sanctions screening run in parallel rather than sequentially, and a human credit officer who reviews output rather than produces it. That officer is still in the workflow — the AI does not make final credit decisions — but the labor content shifts from production to review, which is roughly a 6:1 reduction in time per file.
At 1,000 files per year — a mid-sized regional commercial portfolio — the cost delta is $16.4 million in annual operating savings before netting implementation costs. The Forrester Wave on Commercial Lending platforms published in early 2026 found that enterprise implementation costs for AI underwriting systems, including integration and model validation, are averaging $11-14 million for institutions in the $10-50 billion asset range. The arithmetic produces a 7.2-month payback, which is the figure McKinsey's banking practice has been citing in board-level conversations.
Where the Throughput Lift Comes From
The 11% lift in approval throughput is the number most CFOs underweight, because it looks modest relative to the cost savings. It is not. When you reduce the time-to-decision from 14 days to 4.5 days, you do not simply process the same deal flow faster — you change which deals you can realistically pursue. Relationship managers who previously had to make portfolio triage decisions — which deals to prioritize given analyst capacity — can now run more complete pipelines. The yield on that incremental throughput is spread, not efficiency.
Consider a bank with a 300-basis-point average spread on commercial credits, an average loan size of $4 million, and a 11% throughput improvement on a pipeline of 1,200 decisions per year. The incremental 132 credits, even at a conservative 60% close rate, represent roughly $317 million in incremental loans outstanding and approximately $9.5 million in annual net interest income. That is the number that belongs on the board deck alongside the cost-per-file comparison.
The Credit Quality Question CFOs Are Required to Ask
The legitimate concern with any AI-assisted underwriting deployment is whether the throughput lift comes at the cost of credit quality. It is the right question, and the data available through 2025 suggests the answer is favorable — but with important conditions.
Deloitte's Center for Financial Services reviewed early-vintage performance data from three institutions that deployed AI underwriting in 2023 and 2024. Through 18 months of performance, net charge-off rates on AI-assisted credits were within 8 basis points of the institution's 5-year baseline, within normal statistical variation. The explanation is that AI models trained on institutional credit data tend to apply credit standards more consistently than analyst cohorts of varying experience — removing the tails of the distribution in both directions.
The condition attached to that finding is model governance. Institutions that saw credit quality hold were running quarterly model validation processes, maintaining human override logs, and operating with documented escalation criteria. Institutions that treated the AI as a black box were not in the sample for obvious reasons — they had not progressed to production.
The Competitive Spread Dynamics
The most underappreciated consequence of AI-augmented underwriting is not what it does to any single institution's cost structure — it is what it does to pricing competition in commercial lending markets. When one or two regional banks compress time-to-decision to under five days, the competitive pressure on relationship managers at slower institutions is immediate. Borrowers notice cycle time. Brokers notice cycle time. The 14-day decision bank is not competing on the same terms as the 4.5-day decision bank, regardless of rate.
Forrester's 2026 survey of commercial banking CFOs found that 44% identified competitive cycle-time pressure as a primary driver of their AI investment thesis — ahead of cost reduction, which ranked second at 38%. The market signal is clear: speed is becoming a pricing variable, and institutions that cannot match it will either concede spread or concede market share.
Implementation Risk: What the Payback Period Assumes
The 7.2-month payback figure assumes a clean implementation, and commercial lending AI implementations are rarely clean on the first pass. The primary sources of implementation friction are data quality — financial spreading models require consistent historical data structures that many banks' legacy cores do not provide — and model validation timelines imposed by prudential regulators.
Institutions that have navigated these constraints successfully share two characteristics. First, they treated model validation as a workstream that runs in parallel with technical implementation, not as a gate that comes after. Second, they defined a narrow initial scope — typically a single credit product and borrower segment — and expanded scope after achieving validation approval, rather than attempting enterprise-wide deployment in a single program.
McKinsey's banking practice notes that institutions following this phased approach achieve production deployment in an average of 8 months, versus 18 months for institutions that attempted broad initial scope. The difference in time-to-value is significant enough that the phased approach produces superior NPV in virtually all modeled scenarios.
The Takeaway
The commercial case for AI-augmented underwriting no longer requires assumptions about future model capability improvements — the unit economics at current capability levels justify the investment on a standalone basis. CFOs at regional and super-regional banks who have not yet moved past pilot should define a specific credit product, run a formal model validation process in parallel with implementation, and underwrite the full business case including the throughput-driven revenue upside, not just the cost-per-file reduction. The 7.2-month payback is achievable; the 14-day cycle time is not defensible.
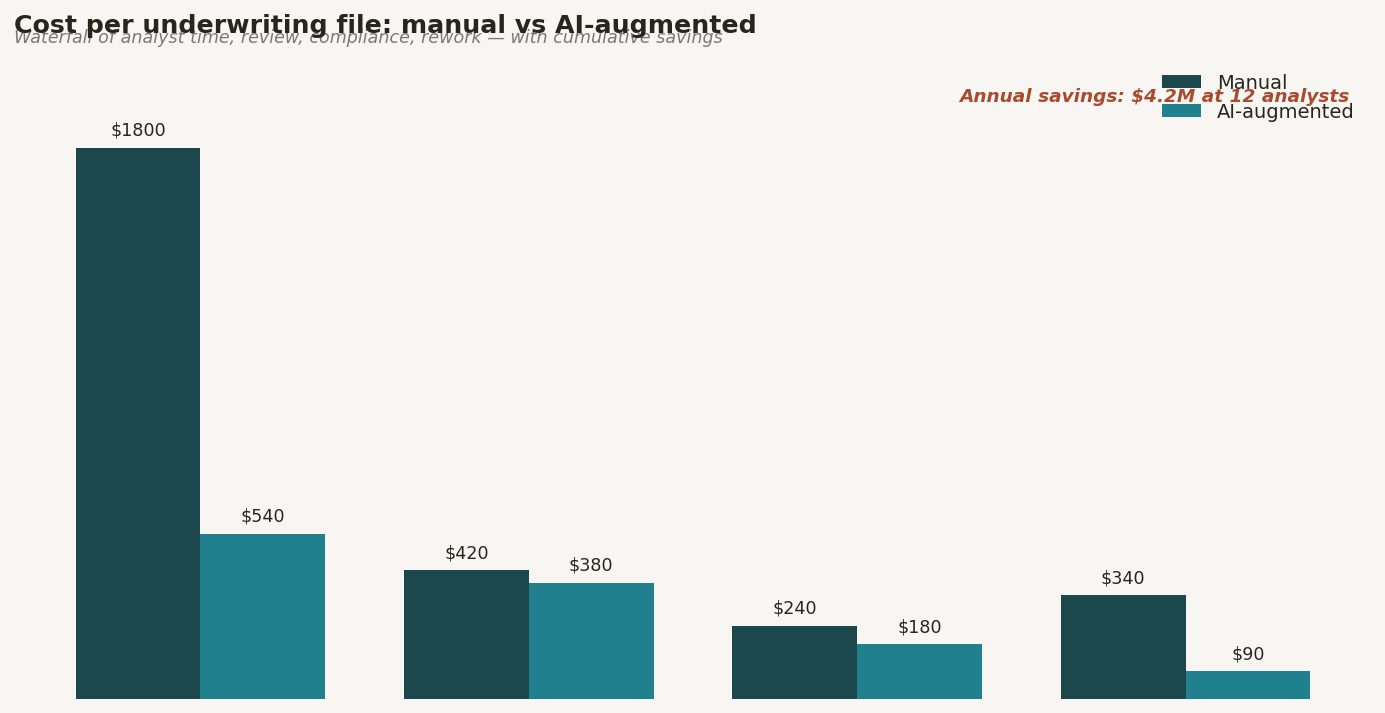
Figure 1. Waterfall bar chart showing cost-per-file components (analyst time, review, compliance, rework) for manual vs AI-augmented workflows, with cumulative annual savings curve overlaid on right axis.
Comments (0)
Join the conversation!